Performance enhancement can be a daunting but rewarding task in software development. Embarking on improving a part of a web application or a feature might result in either decreased server and operational costs and an improvement of user experience, but the amount of time, knowledge and sometimes experimentation that has to be poured into it has to be taken into account before spending developer time that can be used elsewhere; that is of course, unless a performance problem has reached the point of breaking a feature or an important process entirely.
This article will try to give some tips mainly on the backend side of things and mainly with the use of ruby on rails and New Relic; but some of the concepts apply to any stack and monitoring tool.
Choose your adventure
It’s important to note that although the backend is important and it is the focus of this article, the decision to embark on performance has to take into account everything that happens when the user loads a page; and that means the size of the images, the amount of javascript downloaded, the backend response and the frontend manipulations done with it, etc.
For example, would it pay to spend a couple days of developer time optimizing an endpoint from from 2000 ms to 500 ms if the user has to spend 6 seconds waiting for a page to load because of badly sized images? I doubt it.


Jump into your ‘transactions’ view, it’ll show you the most time-consuming endpoints you have that have been tracked by new relic in that period. Let’s take a look at the top 20 slowest transactions:


In this case we’re going with an endpoint that we perceive it has high value and medium effort which is the Jobs#show, and as you might guess it’s extremely important for our SEO and our users to display the jobs page as fast as possible.
Eyes on the target: Viewing and analyzing transaction traces
Let’s click on Jobs#Show transaction and examine it.

On the surface, there doesn’t seem much to do here with just a response of 245 ms right? But we can see from the graph and the breakdown table 2 things:
- Most of the time spent is by the database (Postgres)
- The Postgres Job find is called more than twice on average (!)
Both the time % and the Avg calls/Txn are important to pinpointing what to look at with this endpoint. But we can get more detail if scroll down and see if there are any ‘slow transactions’ marked by New Relic:


This profile is showing us where time was spent in the whole 22.74 seconds of this request, and breaking it down into parts. We can see 95% of it was just one query on the activities table to find out the last time the job was checked and while it is alarming, it’s hard to know if it is an isolated case. Let’s look at another one:

Apply to development jobs here
Attacking our performance problem
Let’s look at the ruby haml code for that view partial:
- related_jobs = @job.related_jobs
- if related_jobs.present? && !team_member_signed_in?
  %h3.w900.size4.mb2=t("jobs_related", country: t("country"))
  .browse-widget--small.space-between.mb4
    - related_jobs.each do |j|
      - cache(j) do
        = render partial: "related", locals: {job: j}
The query itself was produced on this partial and not the partial for each of the related jobs, plus that one is cached. Let's run this query produced by the method on the seed database with conditions similar to production (ideally) and call to_sql on it with the rails console:
puts @job.related_jobs.to_sql
=> SELECT DISTINCT "jobs".* FROM "jobs" .... LIMIT $;
Now we will go into PostgreSQL with something like `rails db` and put this in there, prepending an EXPLAIN ANALYZE statement to give us information to analyze this and any query.

The query plan and analysis result is a lot of text too long to post here; For an experienced database administrator this might be readable, but as I'm a humble web developer I recommend pasting this into something like https://explain.dalibo.com/ or any query plan analysis website to make more sense (Just make sure you check the data retention policies of what you use and don't upload any sensitive data).
Anyway, pasting this into the website I just mentioned gives us a result like this:


CREATE INDEX index_test ON jobs(category_id, tenant_city_id, hidden, confidential, state);
I recommend to do this on the psql console directly for your development environment rather than migrations, since you will have to create and dump several indexes until you find one that is used by postgres and improves your situation, since depending on the data postgres might find it easier to just sequentially scan our table and then we aren’t doing much. Anyway, adding this index and checking the plan gives us a different result:

Our sequential scan has now turned into an bitmap index scan, and reading a bit about it we find it’s a middle ground between a sequential and an index scan, getting advantages of both; The timings look better and now the query plan parser is actually looking at the weight_things table index scan as the slow part, but with it being already an index scan we’re probably going to have to spend a lot of time there for less results (remember our prioritization framework)
Deploy, but don’t forget
The next step is obviously to make a migration with this and deploy it; but it doesn’t end there, we need to check new relic average transaction time and compare it with the previous period to confirm this is giving the results as intended, since we were mainly testing this on a specific transaction.
Here's how it looks comparing the time of this endpoint before/after the deployment, waiting for a week to average more data:

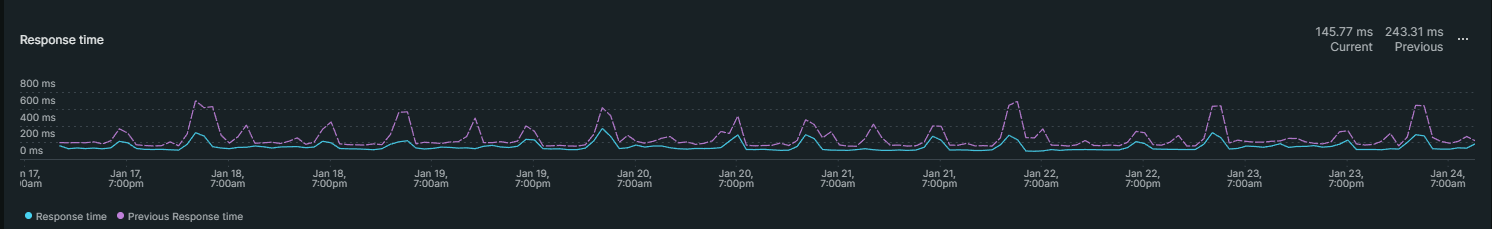
New relic can compare this week's performance to the last one, and we can see how our endpoint is faring much better; remember, 46% timing for our server does not translate to 46% page load for a user, since there's the frontend and other pieces at play. But it will have an impact in that and our server load and bills.
It’s important to also understand we have to consider each index added slows down writes to this table, but this table is a low-write frequency model unlike other tables we have. Other improvements we can make is to cache this query result for each job, but then we might not feature some new jobs during the cache refresh period.
Hopefully, this guide helped on how to prioritize and approach performance enhancements.
***************
Your next remote job awaits for you at: getonbrd.com
Cover foto: Tim Mossholder on Unsplash